CONTOUR ECG ANALYSIS
A feature of a Bioscanner Wellness when conducting electrocardiography is ability to perform the contour ECG analysis. This module is intended for finding diagnostically significant points on ECG graph as well as calculation of the cardiogram parameters. The obtained data help to detect different heart diseases. Contour analysis is performed in the first standard lead, so it is sufficient to record 4-channel ECG (not connecting chest electrodes V1… V6).
After diagnostics is completed, the software puts markers according to control points on the ECG automatically, as well as calculates base ECG parameters, performs an assessment of the cardiac rhythm and heart axis position.
To work successfully with the module of contour analysis, you should understand the basic principles of the cardiosignal structure. Standard ECG graph includes a lot of repetitive, similar segments, called cardio intervals (R-R intervals). Each cardio interval in turn consists of set of peaks and lows (waves) specific to the different time intervals of cardiac activity. ECG graph of a healthy person depends on the body type, level of training and other factors. To evaluate ECG, it is necessary to compare the values of wave height, duration and deviation of segments to normal ranges.

ECG PARAMETERS
There are segments, waves and intervals on the ECG graph. A section of a straight line (isoline) between two neighboring waves is called an ECG segment. Cardiogram waves are indicated by Latin letters P, Q, R, S, T, according to the order in which they appear from left to right. There are negative waves (Q or S waves; besides, T and P waves can be negative as well), i. e. below the isoline, or positive waves (T, P, R,), i. e. above the isoline. An interval consists of a wave (wave complex) and a segment. Thus, an interval = a wave + a segment. The most diagnostically significant are the P-Q and S-T segments, the most important intervals are P-Q and Q-T.
P WAVE
The P wave represents an atria activation. The P wave is registered first. It is a small, spherical, not steep deflection, preceding the serrated QRS complex. It is better to see the atria state in V1 and V2 leads, because chest leads are located closer to these cardiac compartments than standard leads. The beginning of the P wave corresponds to activation of the right atrium, the middle part represents the end of this process and beginning of the activation of the left atrium. The end of the P wave is generated by the left atrium.
Normal P wave is always positive in I, II, aVF, V2–V6 leads. In III, aVL, V1 leads the P wave can be positive or diphasic (one wave part is positive and another part is negative). In aVR lead the P wave is always negative.
Normal P wave duration does not exceed 0.1 sec, normal amplitude (height) is between 1.5 and 2.5 mm or no more than 0.25 mV (in standard calibration 1 mV = 10 mm). Usually, the deviation of these parameters from normal values points to the atrial hypertrophy.
The top of the P wave can be split, while the distance between waves must not exceed 0.02 sec. Time of the right atrium activation is measured from the beginning of P wave to its first top (no more than 0.04 sec). Time of activation of the left atrium is measured from the beginning of P wave to its second top or to the highest point (no more than 0.06 sec).
In significant damage of the atrial myocardium this wave is usually shortened, elongated and split. In so-called atrial fibrillation, when atria contract very quickly and irregularly, there are irregular isoline waves instead of the P wave.
QRS COMPLEX
QRS complex is a ventricular complex that is registered during activation of the ventricles. It is the largest complex on the ECG. The complex consists of several spiky waves: positive (above the baseline) and negative (below the baseline). N point is a transition point from the isoline to the Q wave (the beginning of the QRS complex). J point is a transition point from the S wave to the S-T segment (the end of the QRS complex).
The width of the QRS complex represents duration of intraventricular activation. Its normal value is 0.06–0.08 sec (up to 0.1 sec). The width of QRS complex decreases slightly with the heart rate increase and vice versa. The shape of the complex may change in ventricular premature beats (ventricular extrasystoles) and other conduction disorders. QRS complex is enlarged in His bundle branch blocks.

Q WAVE
The Q wave (initial wave of the QRS complex) is registered during activation of the left side of the ventricular septum. It must be present in chest leads V4, V5, V6. The Q wave is not registered (otherwise it is considered as abnormality) in chest leads V1, V2, V3. Normal width of the Q wave must not exceed 0.03 sec. The Q wave amplitude in each lead must be less than 1/4 of amplitude value of following R wave in the same lead. The amplitude must not exceed 0.2 mV (with the exception of the standard lead III). Normal Q wave shall not be split.
R WAVE
The R wave (the main wave on the ECG) represents a ventricular activation. The R wave amplitude in standard and unipolar limb leads depends on the position of the electric axis of the heart.
This wave, the same as Q wave, can be registered in all standard and unipolar limb leads. Amplitude increases in leads from V1 to V4: RV4>RV3>RV2>RV1 (while RV1 wave can be absent) and then it decreases in V5 and V6 leads. R wave amplitude in each standard and unipolar limb lead (in adults) must not exceed 2 mV. In I lead its value must not exceed 1.5 mV. In any of chest leads R wave amplitude must not exceed 2.5 mV.
S WAVE
The S wave (inconstant wave) represents a final activation of the left ventricle base. It is the deepest negative wave on ECG. It gradually decreases from V1 to V6. It is normal if this wave is absent in V5 and V6 leads. S wave amplitude may vary, but in I, II, aVF leads it must not exceed 0.5 mV.
S-T SEGMENT
The S-T segment is very important for diagnostics of cardiac disorders. It is necessary to pay special attention to the S-T segment in IHD (ischemic heart disease), because it reflects the oxygen deficit (ischemia) of myocardium. The S-T segment is measured from the J point to the beginning of the T wave. The J point (from a word “junction”) can be determined on the cardiogram by change in the slope of the vertical curve of the end of QRS complex and its transition to the horizontal part, i. e. the beginning part of the ST segment.
Normal elevation (a deviation above the isoline) of the segment must be no more than:
0.1 mV in limb leads, 0.3 mV in V1 and V2 leads, 0.2 mV in V5 and V6 leads.
Depression (a deviation below isoline) of S-T segment must be no more than:
0.05 mV in limb leads.
Deviation of the S-T segment is measured according to the formula J+60 or 80 ms (it depends on pulse rate). Deviation of the S-T segment is considered diagnostically significant if its duration from the J point is between 0.06 and 0.08 sec.
T WAVE
T wave represents a repolarization process (the recovery of resting potential or the resting phase) of the ventricles. It normally begins on the isoline after the S-T segment. Normal T wave is not split and its first half has a more gradual slope than the second half. Normal T wave is always positive in leads I, II, aVF, V2-V6, while TI > TIII, а TV6 > TV1. T wave is always negative in aVR lead. T wave amplitude (standards have not developed) in standard and unipolar limb leads is usually between 0.3 and 0.6 mV (up to 0.8 mV). T wave duration shall not be less than 1/8 or more than 2/3 of amplitude of the preceding R wave. T wave duration varies from 0.16 to 0.24 sec and has no great diagnostic value.
Q-T INTERVAL
The Q-T interval is called an electrical systole of the ventricles, because during this time period all ventricular compartments are activated. It is a time interval from the beginning of the QRS complex to the end of the T wave. The Q-T interval duration depends on gender, age, heart rate. Normal QT interval shall not be more than 50% of the preceding R-R interval. If the Q-T interval is normal or abnormal on the ECG of the patient, it can be determined upon the Bazett’s formula. The Q-T interval is considered abnormal if its value exceeds 0.42:
QTb = QT (measured on ECG) / √(R-R) (an interval between two neighboring R waves, measured on ECG)
The possible cause of the QT interval elongation is hypokalemia (hypocalcaemia), the cause of the QT interval shortening is hyperkalemia (hypercalcaemia).
T-P INTERVAL
It is an interval between the end of the T wave and the beginning of the P wave. It represents a cardiac relaxation period (a flat line on the ECG).
ELECTRICAL AXIS OF THE HEART
The standard leads of cardiac electrical impulses from the bode surface register the potential difference between two limbs. The first standard lead is a potential difference between electrodes on the right and left arms. The second standard lead is a potential difference between the left leg and the right arm. The third standard lead is a potential difference between the left leg and the left arm (the negative electrode). These three leads form an equilateral triangle (it is called the Einthoven Triangle) with corners on the limbs on which electrodes are placed. In the middle of the triangle the electrical center of the heart is located, that is equidistant from every lead.
The electrical axis of the heart is the projection of the resulting vector of ventricular excitation in the frontal plane. Direction of the electrical axis of the heart represents the total value of bioelectrical changes that occur in myocardium with each contraction. The position of the heart axis is only an additional parameter in the diagnosis of diseases.
The direction of the electrical axis of the heart is determined from the angle alpha and measured in degrees. The angle alpha is formed by the electrical axis of the heart and the horizontal line that is drawn through the conditional electrical center of the heart, i. e. lead I axis, shifted towards the center of the Einthoven Triangle.
The angle alpha in healthy individuals may vary from 0° to +90°, depending on the body type. There are three types of position of the electrical axis of the heart depending on the physique of a person:
normal position: alpha angle is between +30° and +70°;
horizontal position: alpha angle is between 0° and +30° (can point to hypersthenic body type);
vertical position: alpha angle is between +70° and +90° (can point to asthenic body type).

The normal angle of the heart axis in people over 40 years old is between –30 and +90°, in people younger 40 years it is between 0 and +105°. If the electrical axis of the heart is deviated, it is not a diagnosis. However, such changes on the electrocardiogram can indicate different cardiac disorders. Most often the deviation of the electrical axis of the heart is related to ventricular hypertrophy, but to specify the nature of a heart condition, it is necessary to analyze other parameters. For example, the left axis deviation can point to left ventricular hypertrophy or overload. The right axis deviation can point to right ventricular hypertrophy or overload. It can be a sign of age-old chronic disorder, so usually the emergency medical assistance of cardiologist is not required. However, the deviation of the electrical axis of the heart related to His bundle branch block poses a danger. This situation calls for emergency medical assistance of cardiologist and treatment in a specialized hospital.
CARDIAC RHYTHM ANALYSIS
Rhythm regularity is evaluated by R-R intervals. If the waves are situated at equal distances from each other, rhythm is called regular. The duration range of different R-R intervals is allowed no more than ± 10% of their average duration. If rhythm is sinus, it is usually a regular beat rate.
SINUS RHYTHM
It is a normal rhythm, whereas other are abnormal (i. e. they indicate cardiac disorders). The pacemaker is situated in the sinoatrial node. ECG signs:
In II standard lead P waves are always positive and situated before each QRS complex, P waves in the same lead have a constant similar shape.
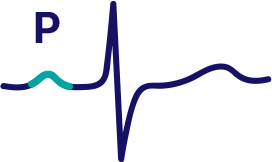
P wave in sinus rhythm
ATRIAL RATE
If a pacemaker is situated in the lower atrial regions, the cardiac impulse spreads to atria from bottom to top (retrogradely), so:
- P waves in II and III leads are negative,
- there is a P wave before each QRS complex.
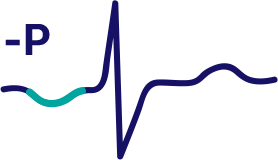
P wave in atrial rate
Atrial rate is an abnormal heart rhythm. Characteristics of atrial rate: a pacemaker is situated in the lower atrial regions, the cardiac impulse spreads to atria from bottom to top (retrogradely), so P waves in II and III leads are negative.
RHYTHM FROM AV NODE
If a pacemaker is situated in the atrioventricular node, ventricles are activated as usual (from top to bottom), but atria are activated retrogradely (i. e. from bottom to top). There are the following signs on ECG:
P waves may be absent because they can be buried in normal QRS complexes,
P waves can be negative and located after each QRS complex.
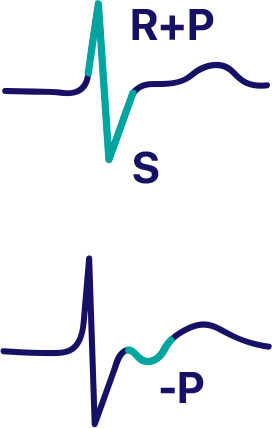
The rhythm from AV node, P wave is buried in QRS complex
The rhythm from AV node, P wave is located after QRS complex
The rhythm from AV node is associated with HR which is slower than sinus rhythm. It is about 40-60 beats per minute.
VENTRICULAR OR IDIOVENTRICULAR RHYTHM
In that case, the pacemaker is a ventricular conduction system. The impulse spreads through the ventricles by abnormal pathways and because of that it spreads slower.
Characteristics of idioventricular rhythm:
QRS complexes are wide and deformed. Normal QRS complex duration is 0.06–0.10 sec. This rhythm is associated with duration of QRS complex more than 0.12 sec.
There is no fixed ratio between QRS complexes and P waves, because AV node does not release impulses from ventricles, but atria can be activated normally, from the sinus node.
HR is less than 40 beats per minute.

Idioventricular rhythm. There is no connection between P wave and QRS complex
CONTOUR ANALYSIS PROCEDURE
Connect Bioscanner to a laptop or a computer to record an ECG. An electric shock hazard is excluded, because the device is supplied by USB port. Measurements are carried out during 30 seconds with a patient in a sitting or lying position.
ECG contour analysis is performed in the first standard lead, so it is sufficient to fix on the person’s body 4 electrodes only:
Red electrode − on the right arm,
Yellow electrode − on the left arm,
Green electrode − on the left leg,
Black electrode − on the right leg.
It is necessary to provide close contact between entire surface of electrodes and patient’s skin. A poor contact leads to distortion of the measurement results or absence of data. The chest lead cables not used during four-channel ECG recording should be put aside avoiding the contact between their plugs and device case.
 There is no discomfort during the procedure. To provide the best contact, the corresponding skin areas before electrodes placement should be wiped with alcohol solution. After that moisten the contact surfaces of electrodes as well as skin under them with hypertonic solution. To prepare it, you should dissolve a whole teaspoon of salt in 100 ml of cooled boiled water. When placing electrodes, pay particular attention to reliable contact between black electrode and skin of the leg (in case of poor contact the interference level increases). It is possible to place electrodes over nylon stockings, but in that case more amount of hypertonic solution is required to moisten an area underneath the electrode.
After electrocardiogram recording, select the clearest R-R interval with minimal interference and artifacts on the ECG graph using the mouse. The software detects control points automatically, but selection by the program can be incorrect due to the complexity of the calculations and unclear shape of the ECG graph. In that case, you should correct marker positions (positions of waves) of the specific diagnostic points on the curve by dragging them with the mouse and moving towards the wanted direction.
The accuracy of diagnosis depends heavily on how correct the markers are set. Besides, the contour analysis considers the base ECG characteristics only and cannot be considered as a ground for the establishment of clinical diagnosis. In case you suspect a cardiovascular disorder, a cardiologist must read the ECG.
Recorded ECG is displayed on the screen of a computer on the clear reference grid. Duration of waves and segments can be measured automatically. The ECG can also be printed.
CONTRAINDICATIONS
Electrocardiography does not affect the body, because ECG is a registration of the electric signals produced by the heart itself. There are no contraindications. Electrocardiography can be performed at any age, during pregnancy, in any diseases. Skin damage in the areas of electrode placement can be considered as a relative contraindication.
One hour before the ECG recording the examined person should not smoke, eat, drink tea or coffee. Before electrode placement it is necessary to lie down for several minutes to exclude the impact of physical activity. The room temperature should be maintained within + 19°–23°С to avoid the muscle shivering.